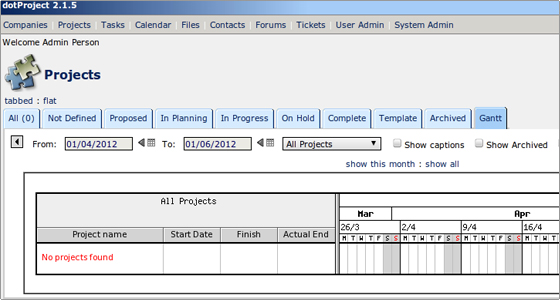
The Gantt chart module is also pre-installed in dotProject.
Once you create a new project, you can view the chart performing the following steps:
1.Go to Projects from the main menu.
2.Click on Gantt.
3.The statistics can be generated manually by selecting the time interval from the drop-down menu and then clicking on Submit.


 Phone: 1(877) 215.8104
 Login
Login